What is call stack and stack trace in C#
In computer science (CS), a call stack is a stack data structure which stores detail information about the active subroutines of a program. This kind of stack is also known as an execution stack (ES), program stack (PS), control stack, run-time stack, or machine stack, and is often referred as just "the stack".
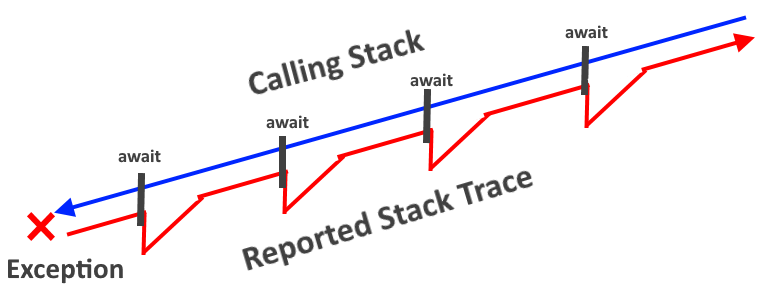
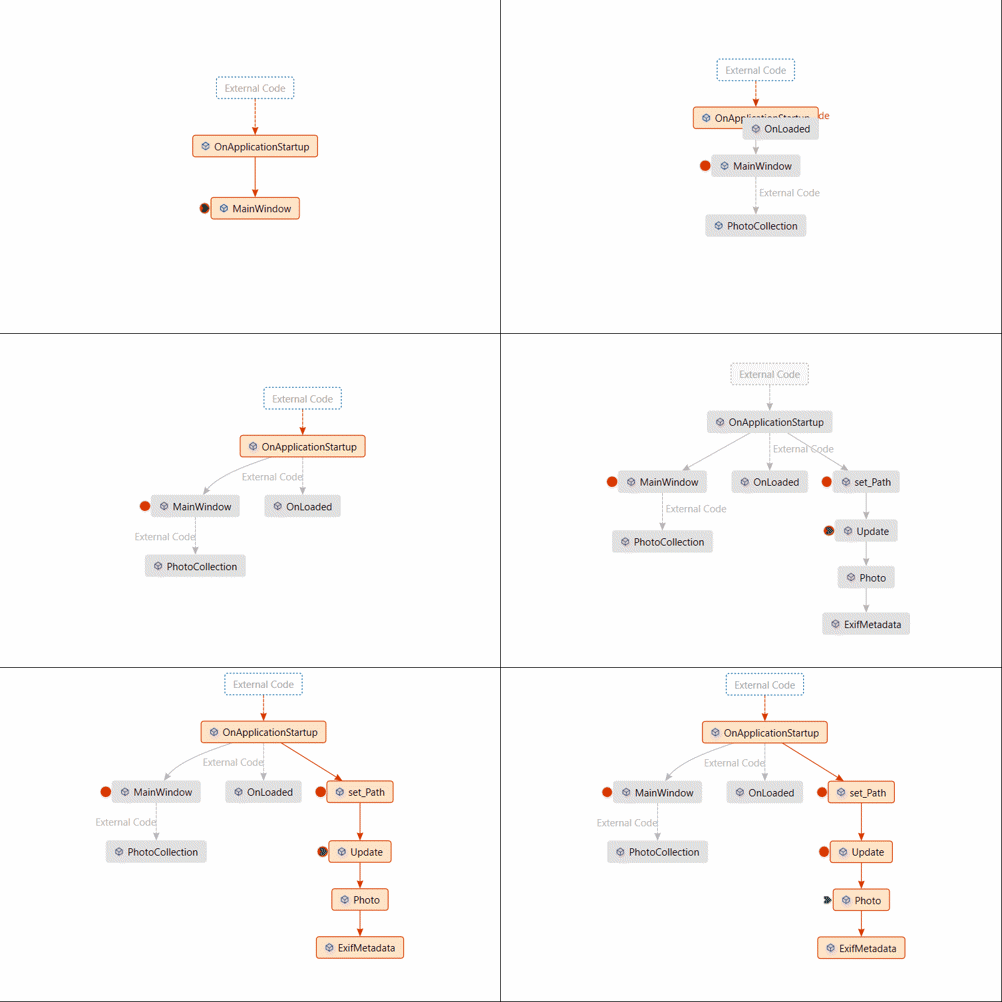
By using a Call Stack window, we can view the function or procedure calls which are currently on the stack. A Call Stack window shows us the order in which methods and functions are getting called. The call stack is a good way to examine & understand the execution flow of an application.
Whereas stack trace in C# is the execution stack keeps track of all the methods that are in execution at a given instant. A trace of the method calls is termed as a stack trace. A stack trace listing provides us with a way to view the call stack to the line number in the method where the exception occurs.

In System.Diagnostics Namespace we have StackTrace which can be used like
System.Diagnostics.StackTrace sTrack = new System.Diagnostics.StackTrace();
or simply try in Console,
Console.WriteLine("StackTrace: '{0}'", Environment.StackTrace);
/*
This example produces the following results:

StackTrace: '   at System.Environment.GetStackTrace(Exception e)
   at System.Environment.GetStackTrace(Exception e)
   at System.Environment.get_StackTrace()
   at Sample.Main()'
*/
We can also use StackTrace in try catch as well,
try
{
    //some code here throws exception
}
catch (Exception ex)
{
    string logMessage = ex.ToLogString(Environment.StackTrace);
    //write logMessage to file
}

In a hierarchical view of the stack trace detail by class, we use the StackTrace class. For full access to the resource protected by the permission. Associated enumeration
We can also do this in the Visual Studio debugger without modifying the code.
Having an idea of how to trace call stack help to understand the internal working mechanism and help to solve the problems well.
